
Drone Busters

Project Data
Accurate RF Signal Detection

-
SDR output of the FM radio spectrum spanning 88MHz - 108MHz. Frequency 104.9MHz was selected and the radio station K-Hitz was played.
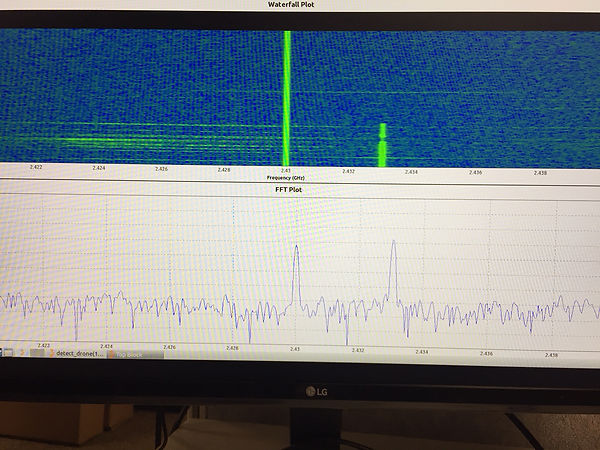
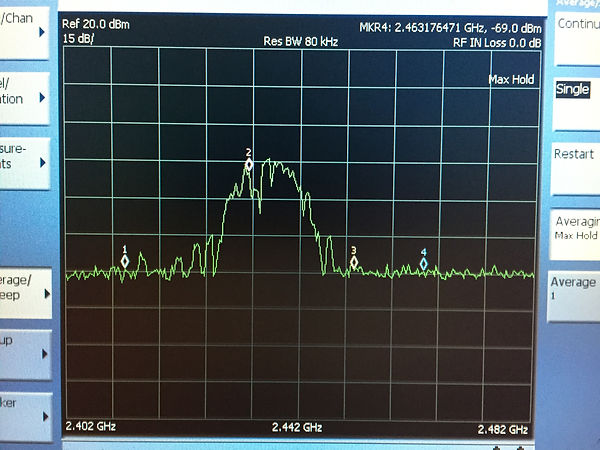
Detection of Drone Signal
-
Device Output of the 2.43GHz spectrum. The small signal peak on the right is the pairing signal of our drone
Yagi Antenna Test Results
-
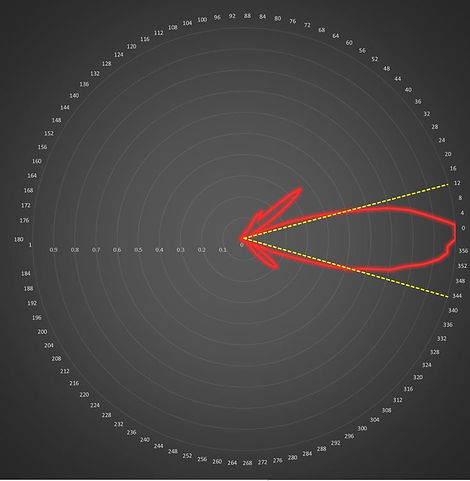
This is a polar plot of our beam width test of the Yagi antenna. The inner axis is the normalized power gain. At half power (3dB drop) we have marked the plot to show its beam width. The beam width comes out roughly to 30°.

-
This characterization of the Yagi antenna revealed a beam width of 32°. The final overall gain of the antenna and transmission line came to an unimpressive 0 dB.
SNR of Receiver

-
This graph shows the signal-to-noise ratio when the RF amplifier, IF amplifier and Base Band amplifier were set to various dB gain settings. The test was conducted with an input signal of -80 dBm being fed through a high frequency cable.
Drone Signal Characterization II

-
This is an image from the NSO9030A PXA Real Time Signal Analyzer showing the FSK signal originating from the drone controller. The pairing signal between drone and remote can be seen from the bottom of the graph, centered at 2.412GHz. The drone communicates by sending signals through one channel at a time at slightly varying frequencies within the channel to avoid interference from other ISM band operating devices.
-
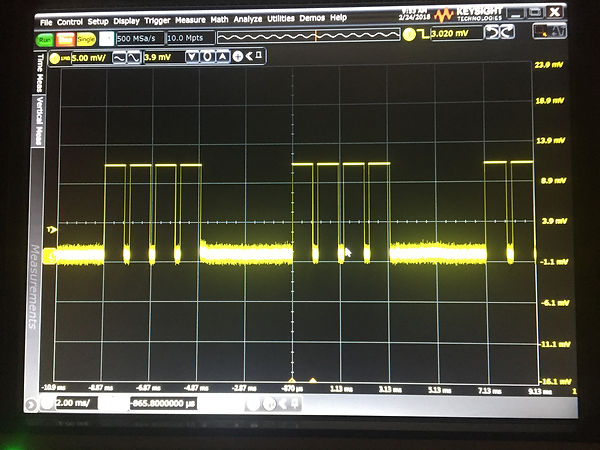
Here is a time domain depiction of our drone signal, using the Keysight MSOS804A Mixed Signal Oscilloscope. The signal transmits for about 1ms within each channel, takes 4ms to deliver the entire signal and then remains silent for 4ms. This repetitive behavior could allow for distinction between interfering WiFi signals.
First Field Test


Field Test

Computational Limits

-
This graph shows the relationship between the FFT size of the radio and the time for the device to complete one iteration of an FFT calculation.
-
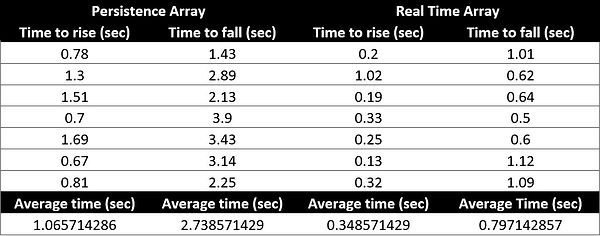
The timing of the LED notification arrays are given in the above table. Our slowest array reaction time is the fall time of the high persistence array. Its average time of 2.74 seconds is almost half the required time of 5 seconds.
WiFi Interference Characterization

-
The above image shows the behavior of two separate WiFi networks. Both signals occupy a channel that is about 20MHz in bandwidth. This means that WiFi could only interfere with one of the FSK channels that our drone uses at a time. Therefore, overcoming WiFi interference is accomplishable and will be addressed in phase 2 of this project.
-
This is the characterization of a third WiFi network signal. This third test proved that WiFi routers operate anywhere within the spectrum window from 2.412GHz to 2.462GHz with a 20MHz bandwidth window.
-
This is the characterization of a third WiFi network signal. This third test proved that WiFi routers operate anywhere within the spectrum window from 2.412GHz to 2.462GHz with a 20MHz bandwidth window.
Device Current Draw

-
This graph shows the current draw from the device every 15 minutes in the blue. The orange is the summation of these intervals over one hour. The total milli-amp hour draw of our device is 730 mA.
-
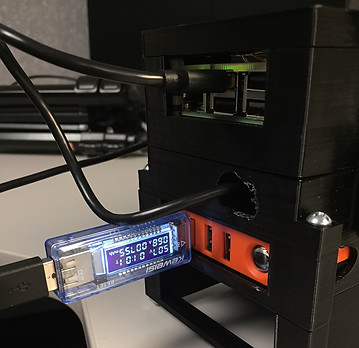
Here is the USB current meter used to measure the current draw of the device.

-
The data from the current meter is contained in this table. Our battery is rated at 20,000 mAh. Therefore, our device can stay operational for a constant 28 hours.
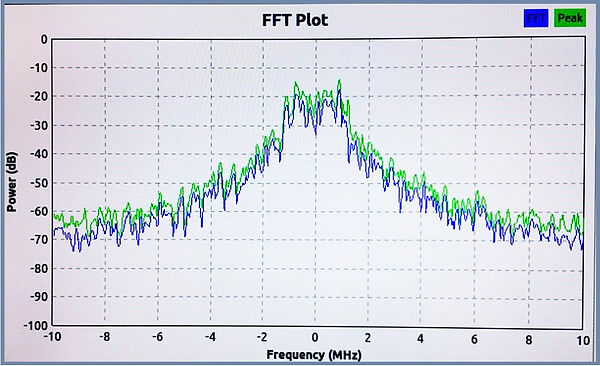
Bandwidth of Radio Receiver
-
The drone FSK channels were measured to be 20MHz wide, as seen on the Keysight real time spectrum analyzer. We also witnessed a majority of the signal being delivered within the center 3MHz of the 20MHz bandwidth channel. Our device has a much higher noise floor than the optimal Keysight signal analyzer we used to characterize the drone signal. This means we only need a mere 3MHz bandwidth to detect a transmission. However, choosing a 20MHz bandwidth window for our device, seen above, allows for the detection of the drone signal along with the measurement of the noise floor. This allows us to compute the SNR for every reading our device takes.
Field Test 2

-
Here is a graphical depiction of the SNR of the drone signal vs the distance to the pilot of the drone in feet. Our engineering requirements were set to have a 3dB SNR at 75 feet, which can be seen above.

-
This table gives the data measured for the device SNR at various drone pilot distances.